The American Revolution: Energy History since 1776
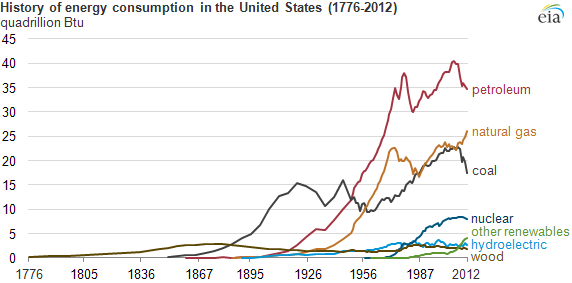
For July 4th weekend the U.S. Energy Information Administration (EIA) published a chart showing trends in energy consumption in the U.S. since 1776, the nation’s founding (see below). It provides a useful perspective on America’s stunning industrialization and current trends, as it negotiates a new energy revolution.
Following in Britain’s footsteps, the U.S. began industrializing during the ‘Second Industrial Revolution’ of the late 19th century, otherwise spearheaded by Germany. The leading energy source on both sides of the Atlantic was coal, as Watt-era steam engines replaced water wheels in textiles and manufacture, and powered the new locomotives. EIA’s chart shows a marked spike in coal use between roughly 1870 and 1910, as use of wood leveled off. The U.S. overtook Britain in coal production during this period.
The next important change in America’s energy history was the large-scale use of petroleum and spread of the internal combustion engine as a replacement for animal power. Coal consumption actually declined after 1920, which is also clear on the chart, as did use of steam engines. This was the era of the Model T and beginning of diplomatic and economic ties with Saudi Arabia (especially over petroleum).
The American energy field becomes more complex as we continue into the 1940s and natural gas. Coal use continued to decline as gas found its way into select industries and city homes for heating and cooking, rendering coal-fired furnaces obsolete. Only the 1970s OPEC oil embargo that shook the U.S. economy checked the steady increase in gas and petroleum consumption. The chart shows a sudden decline in both, but at the same time, a return to coal (a more abundant domestic resource) and appeal to renewables and nuclear power. America also began its love affair with coal-powered electricity around this time.
The nation is now experiencing a new revolution in energy based on unconventional oil and gas. The EIA chart shows the same inverse relation between natural gas and coal in recent year that was evident in the 1940s and 1970s—as one goes up, the other comes down. The current instance is a function of shale gas and the conversion of coal-powered electric plants. From an environmental perspective, this is a suggestive development, given that gas contains less carbon dioxide and fewer particulates than coal.
The gas glut is slowing the rise of wind and solar power, but renewables will continue to capture market share. Interestingly, the chart depicts a decline in oil consumption. Despite a recent surge in shale oil production in Texas and North Dakota, U.S. oil consumption will likely continue to decline because of vehicle emissions standards and changing driving patterns.